echarts疑难杂症_vue echarts饼状图太小-程序员宅基地
技术标签: echarts 前端 javascript
1.调整柱状图、饼图的大小
//柱状图主要根据grid属性中的top/bottom/left/right属性调整大小
let option = {
grid: {
left: 25,
right: 25,
bottom:25,
top:25,
containLabel: true, // 保证label不会被挤掉
},
}
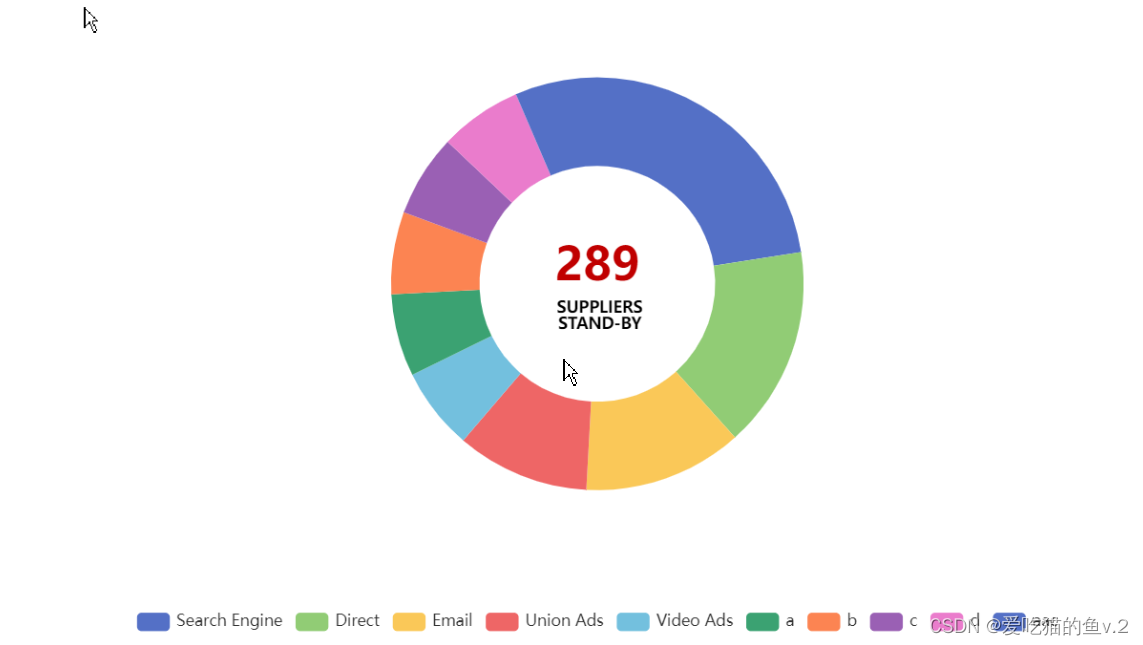
//饼图调整主要根据radius调整饼图的大小(官方描述:数组的第一项是内半径,第二项是外半径),
//调整位置依旧可以按照上下左右以及center属性
//radius[0](案例中的40%,数值越大则越细,反之越粗),
//radius[1](案例中的70%,数值越大则图越大,反之越小)
let option = {
series: [
{
type: "pie",
left: 25,
right: 25,
bottom:25,
top:25,
radius: ["40%", "70%"],
center: ["50%", "50%"],
avoidLabelOverlap: false,
}
]
}
2.嵌套饼图且颜色保持一致

链接: 可以参考该博主
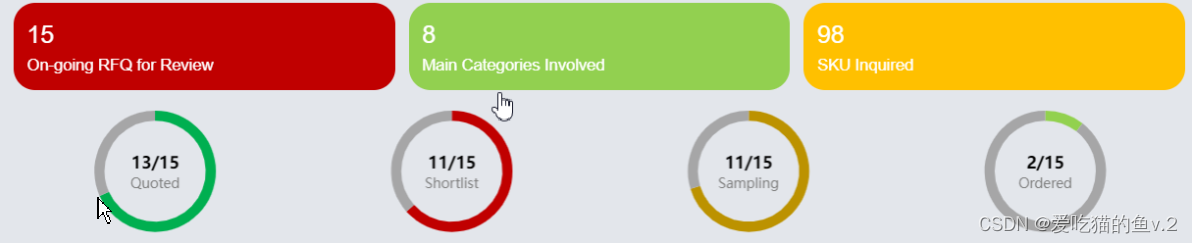
3.并排展示饼图且中间展示文字
//并排展示饼图需要注意center属性,具体摆放位置可以自己调

//展示文字主要取决于formatter属性,如果里面文字过多或者多行文字,
//可以通过"{aaa|我叫aaa}"+"\n"+"{bbb|我叫bbb}",则下面可以通过rich属性去给前面设置的aaa或bbb设置单独样式
let option = {

        series: [
          {

            type: "pie",
            center: ["12.5%", "50%"],
            radius: ["75%", "90%"],
            data: [
              {

                value: 28,
                name: "Quoted",
                label: {

                  position: "center",
                  formatter: "{proportion|13/15}" + "\n" + "{title|Quoted}",
                  rich: {

                    proportion: {

                      fontSize: 12,
                      fontFamily: "微软雅黑",
                      fontWeight: 700,
                      color: "#000",
                      lineHeight: 20,
                    },
                    title: {

                      fontSize: 10,
                      fontFamily: "微软雅黑",
                      color: "#7e7e7e",
                    },
                  },
                },
                itemStyle: {

                  color: "#00af50",
                },
              },
              {

                value: 13,
                name: "",
                label: {

                  show: false,
                },
                itemStyle: {

                  color: "#a6a6a7",
                },
              },
            ],
          },
          {

            type: "pie",
            center: ["37.5%", "50%"],
            radius: ["75%", "90%"],
            data: [
              {

                value: 26,
                name: "Shortlist",
                label: {

                  position: "center",
                  formatter: "{proportion|11/15}" + "\n" + "{title|Shortlist}",
                  rich: {

                    proportion: {

                      fontSize: 12,
                      fontFamily: "微软雅黑",
                      fontWeight: 700,
                      color: "#000",
                      lineHeight: 20,
                    },
                    title: {

                      fontSize: 10,
                      fontFamily: "微软雅黑",
                      color: "#7e7e7e",
                    },
                  },
                  textStyle: {

                    color: "#000",
                    fontSize: 12,
                  },
                },
                itemStyle: {

                  color: "#c00000",
                },
              },
              {

                value: 15,
                name: "",
                label: {

                  show: false,
                },
                itemStyle: {

                  color: "#a6a6a7",
                },
              },
            ],
          },
          {

            type: "pie",
            center: ["62.5%", "50%"],
            radius: ["75%", "90%"],
            data: [
              {

                value: 26,
                name: "Sampling",
                label: {

                  position: "center",
                  formatter: "{proportion|11/15}" + "\n" + "{title|Sampling}",
                  rich: {

                    proportion: {

                      fontSize: 12,
                      fontFamily: "微软雅黑",
                      fontWeight: 700,
                      color: "#000",
                      lineHeight: 20,
                    },
                    title: {

                      fontSize: 10,
                      fontFamily: "微软雅黑",
                      color: "#7e7e7e",
                    },
                  },
                },
                itemStyle: {

                  color: "#bc9200",
                },
              },
              {

                value: 11,
                name: "",
                label: {

                  show: false,
                },
                itemStyle: {

                  color: "#a6a6a7",
                },
              },
            ],
          },
          {

            type: "pie",
            center: ["87.5%", "50%"],
            radius: ["75%", "90%"],
            data: [
              {

                value: 2,
                name: "Ordered",
                label: {

                  position: "center",
                  formatter: "{proportion|2/15}" + "\n" + "{title|Ordered}",
                  rich: {

                    proportion: {

                      fontSize: 12,
                      fontFamily: "微软雅黑",
                      fontWeight: 700,
                      color: "#000",
                      lineHeight: 20,
                    },
                    title: {

                      fontSize: 10,
                      fontFamily: "微软雅黑",
                      color: "#7e7e7e",
                    },
                  },
                  //   textStyle: {

                  //     color: "#000",
                  //     fontSize: 12,
                  //   },
                },
                itemStyle: {

                  color: "#92d14f",
                },
              },
              {

                value: 17,
                name: "",
                label: {

                  show: false,
                },
                itemStyle: {

                  color: "#a6a6a7",
                },
              },
            ],
          },
        ],
      };
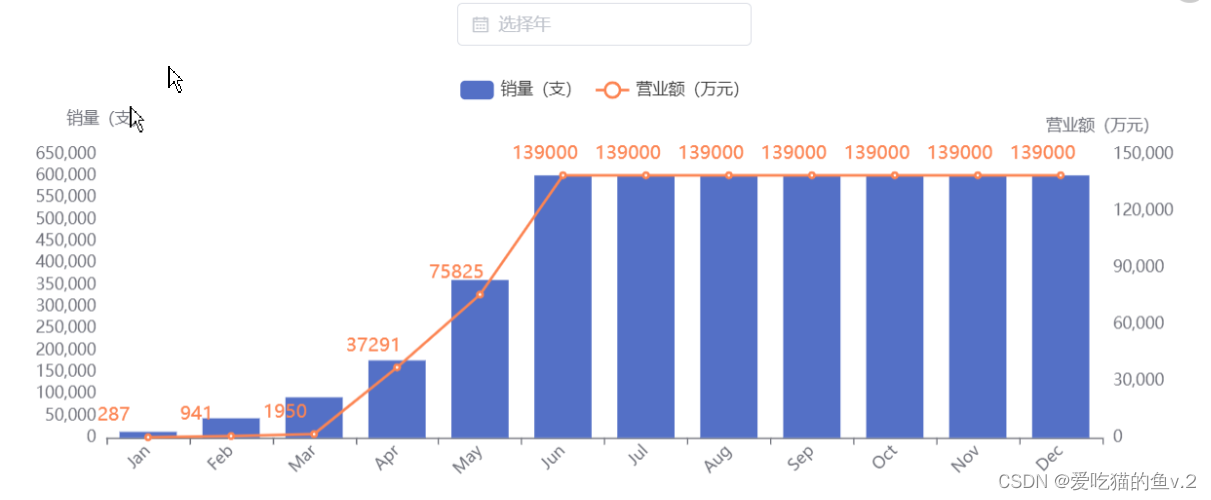
4.折线图(柱状图)双y轴
5.使用echarts5
//安装
npm i echarts5 -S
//引用
import * as echarts5 from "echarts5";
//添加图表后使用
const pieItem = echarts5.init(this.$refs.pieItem);
pieItem.setOption(option);
注意:在vue中使用echarts时,一定得放到mounted生命周期,必须得dom元素挂载后再去渲染,如果是react中则放到useEffect中
6.图形不展示的问题
1.可能是放错了生命周期,例如在vue中,放到了created钩子中,必须放到dom挂载后
2.宽高没有设置,如果不展示,可以先审查元素,如果canvas中的height或width为0也不展示
按需引入等具体配置请
智能推荐
camera tuning名词缩写_高通hjr是什么意思-程序员宅基地
文章浏览阅读564次,点赞2次,收藏10次。CC, color conversion,色彩转换CC, color correction,色彩矫正CE, chroma enhancement,色度增强SNR,signal-to-noise ratio,信噪比SNR, skin noise reduce,肤色降噪STD, standard deviation,标准差OIS, optical image stabilization 光学稳像 PDAF,phase detection auto focus,相位对焦CPP: camera po_高通hjr是什么意思
深度学习哪家强?吴恩达、Udacity和Fast.ai_ai 深度学习-程序员宅基地
文章浏览阅读1.3w次,点赞4次,收藏26次。原文:http://blog.csdn.net/wemedia/details.html?id=43211深度学习哪家强?吴恩达、Udacity和Fast.ai的课程我们替你分析好了原2017.08.20AI科技大本营翻译 | AI科技大本营(rgznai100)参与 | reason_W 引言_ai 深度学习
Matlab小波包分解后如何求各频带信号的能量值?_小波包能量的matlab代码-程序员宅基地
文章浏览阅读5.8k次。异步赠书:Kotlin领衔10本好书 SDCC 2017之区块链技术实战线上峰会 程序员9月书讯 每周荐书:Java Web、Python极客编程(评论送书) window.quickReplyflag = true; var isBole = false; var fasrc="htt_小波包能量的matlab代码
基于openstack安装部署私有云详细图文教程_openstack云平台搭建 最新-程序员宅基地
文章浏览阅读563次,点赞3次,收藏9次。基于openstack安装部署私有云详细图文教程 本文中作者通过自身基于OpenStack搭建私有云平台的实战经验,对OpenStack实施私有云落地的需求进行梳理,综合产生个人的观点和评价并和读者分享。本文主要分享的是云计算、openstack的使用、私有云平台建设、云服务器云硬盘的构建和使用。从基本概念入手到私有云建设,信息量非常大。对于openstack的安装部署都是从..._openstack云平台搭建 最新
vue实现每隔几秒请求一次接口,实现数据更新_vue中每两秒调用一次接口-程序员宅基地
文章浏览阅读1.2w次,点赞2次,收藏37次。项目中我们经常需要实现轮询-每隔几秒请求一次接口实现数据更新1:一般都会使用setInterval,但要注意单纯使用它会导致页面卡死方法1:new Vue({ el: '#app', data: {}, created: function() { var that = this; // setInterval不会清除定时器队列,每重复执行1次都会导致定时器叠加 \ window.setInterval(() =_vue中每两秒调用一次接口
高斯数据库错误参考代码GAUSS-51100——GAUSS-51236_[gauss-50236] : the 192.168.40.130 does not exist -程序员宅基地
文章浏览阅读7.5k次,点赞3次,收藏12次。GAUSS-51100:"Failed to verify SSH trust on these nodes: %s."SQLSTATE: 无错误原因:在各节点上核实SSH互信失败。解决办法:检查确保各节点互信必须创建。GAUSS-51101:"SSH exception: \n%s."SQLSTATE: 无错误原因:远程连接异常。解决办法:检查确保网络连接必须正常;检查确保远程机器的IP及登录用户和密码必须正确。GAUSS-51102:"Failed to exch_[gauss-50236] : the 192.168.40.130 does not exist or the permission on the u
随便推点
FreeModbus——源码获取(一)_freemodbus源码下载-程序员宅基地
文章浏览阅读217次。下载v1.6版本,刚开始我还没找到,后面对照别人的截图才找到(哈哈,感觉自己好二),把鼠标移过去,这个地方是才从黑变成这个绿色。_freemodbus源码下载
PyTorch保存网络结构以及参数【 torch.save()、torch.load() 】-程序员宅基地
文章浏览阅读2.8w次,点赞49次,收藏230次。 对于pytorch保存网络参数,大家一般可以看到有 .pkl文件 以及 .pth文件,对于这两者有什么区别,以及如何保存网络参数等,本文就好好讲述一下。 一、保存方式 首先我们知道不论是保存模型还是参数都需要用到torch.save()。_pytorch保存网络结构
【报错集锦】yolov8报错ModuleNotFoundError: No module named ‘ultralytics‘_modulenotfounderror: no module named 'ultralytics-程序员宅基地
文章浏览阅读1.2w次,点赞12次,收藏21次。yolov8遇到报错_modulenotfounderror: no module named 'ultralytics
【LeetCode刷题笔记(8-3)】【Python】【接雨水】【双指针】【困难】-程序员宅基地
文章浏览阅读961次,点赞20次,收藏24次。LeetCode刷题笔记;算法题:接雨水;核心思想是利用双指针在O(1)空间复杂度下解决【接雨水】问题。【双指针】【python】【困难】
YOLO8实战:yolov8实现行人跟踪计数_yolov8人流量计算-程序员宅基地
文章浏览阅读3.3k次,点赞12次,收藏56次。行人跟踪统计是智能监控系统中的重要功能,可以广泛应用于人流控制、安全监控等领域。传统的行人跟踪算法往往受到光照、遮挡等因素的干扰,难以实现准确跟踪。随着深度学习技术的发展,目标检测模型逐渐成为行人跟踪的主流方案。本文介绍使用YOLOv8目标检测模型实现行人跟踪统计的方法。_yolov8人流量计算
Idea导入的项目不能运行_idea 跑不起来是什么原因-程序员宅基地
文章浏览阅读5w次,点赞69次,收藏277次。Idea导入的项目不能运行Idea导入的项目不能运行Idea导入的项目不能运行其实这个错误是因为没有设置output的路径,只要修改两个地方的设置就可以了:在Modules设置里勾选”Inherit project compile path”2. 设置Project中的”Project compiler output” 选择”Project的路径”+”\out”,比如说我的就是 如..._idea 跑不起来是什么原因