WPF 自定义柱状图 BarChart-程序员宅基地
WPF 自定义柱状图
当前的Telerik控件、DevExpress控件在图表控件方面做得不错,但是有时项目中需要特定的样式,不是只通过修改图表的模板和样式就能实现的。
或者说,通过修改当前的第三方控件以达到项目中UI的界面效果,花费的时间远比重新自定义一个控件要长得多!
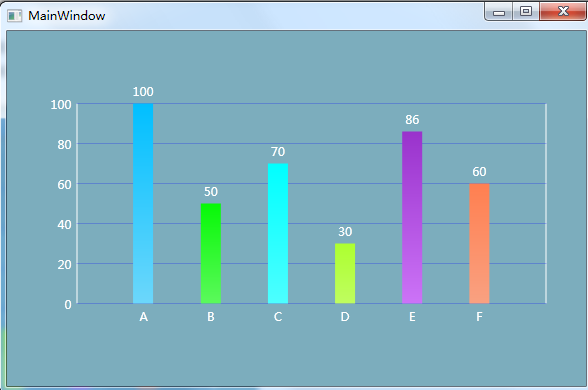
所以直接自定义柱状图吧~下面是柱状图的效果:
Git代码下载:https://github.com/Kybs0/BarChartControl
1、新建一个UserControl,在界面上添加一些简单的布局


<UserControl x:Class="WpfApplication11.BarChartControl"
            xmlns="http://schemas.microsoft.com/winfx/2006/xaml/presentation"
            xmlns:x="http://schemas.microsoft.com/winfx/2006/xaml"
            xmlns:mc="http://schemas.openxmlformats.org/markup-compatibility/2006"
            xmlns:d="http://schemas.microsoft.com/expression/blend/2008"
            mc:Ignorable="d"
            d:DesignHeight="100" d:DesignWidth="200" Loaded="BarChartControl_OnLoaded">
    <Grid>
        <Grid.RowDefinitions>
            <RowDefinition Height="Auto"></RowDefinition>
            <RowDefinition Height="*"></RowDefinition>
            <RowDefinition Height="Auto"></RowDefinition>
        </Grid.RowDefinitions>
        <Grid.ColumnDefinitions>
            <ColumnDefinition Width="Auto"></ColumnDefinition>
            <ColumnDefinition Width="*"></ColumnDefinition>
            <ColumnDefinition Width="Auto"></ColumnDefinition>
        </Grid.ColumnDefinitions>
        <Grid x:Name="HeaderGrid" Grid.Row="0" Grid.Column="1" Height="20">
        </Grid>

        <Grid x:Name="LeftGrid" Grid.Row="1" Grid.Column="0">
        </Grid>
        <Border x:Name="MainBorder" Grid.Row="1" Grid.Column="1" BorderThickness="2,0,2,0" BorderBrush="Black">
        </Border>
        <Grid x:Name="MainGridForRow1" Grid.Row="1" Grid.Column="1">

        </Grid>
        <Grid x:Name="MainGridFrom0To1" Grid.Row="0" Grid.Column="1" Grid.RowSpan="2">

        </Grid>
        <Grid x:Name="RightGrid" Grid.Row="1" Grid.Column="2">
        </Grid>

        <Grid x:Name="BottomGrid" Grid.Row="2" Grid.Column="1">
        </Grid>
    </Grid>
</UserControl>
2、UserControl的后台界面
通过添加一些依赖属性,然后在后台生成界面。也可以把柱状替换成RadioButton,实现柱状图选择,添加选择事件的委托方法。
 /// <summary>
    /// BarChartControl.xaml 的交互逻辑
    /// </summary>
    public partial class BarChartControl : UserControl
    {
        public BarChartControl()
        {
            InitializeComponent();
        }

        public Brush BorderBrush
        {
            get { return (Brush)GetValue(BorderBrushProperty); }
            set { SetValue(BorderBrushProperty, value); }
        }

        public static readonly DependencyProperty BorderBrushProperty = DependencyProperty.Register("BorderBrush",
        typeof(Brush), typeof(BarChartControl),
        new PropertyMetadata(Brushes.Black));

        public Thickness BorderThickness
        {
            get { return (Thickness)GetValue(BorderThicknessProperty); }
            set { SetValue(BorderThicknessProperty, value); }
        }

        public static readonly DependencyProperty BorderThicknessProperty = DependencyProperty.Register("BorderThickness",
        typeof(Thickness), typeof(BarChartControl),
        new PropertyMetadata(new Thickness(1.0, 0.0, 1.0, 1.0)));

        public AxisYModel AxisY
        {
            get { return (AxisYModel)GetValue(AxisYProperty); }
            set { SetValue(AxisYProperty, value); }
        }

        public static readonly DependencyProperty AxisYProperty = DependencyProperty.Register("AxisY",
        typeof(AxisYModel), typeof(BarChartControl),
        new PropertyMetadata(new AxisYModel()));

        public AxisXModel AxisX
        {
            get { return (AxisXModel)GetValue(AxisXProperty); }
            set { SetValue(AxisXProperty, value); }
        }

        public static readonly DependencyProperty AxisXProperty = DependencyProperty.Register("AxisX",
        typeof(AxisXModel), typeof(BarChartControl),
        new PropertyMetadata(new AxisXModel()));
        public double HeaderHeight
        {
            get { return (double)GetValue(HeaderHeightProperty); }
            set { SetValue(HeaderHeightProperty, value); }
        }
        public static readonly DependencyProperty HeaderHeightProperty = DependencyProperty.Register("HeaderHeight",
        typeof(double), typeof(BarChartControl), new PropertyMetadata(10.0));
        public string Header
        {
            get { return (string)GetValue(HeaderProperty); }
            set { SetValue(HeaderProperty, value); }
        }
        public static readonly DependencyProperty HeaderProperty = DependencyProperty.Register("Header",
        typeof(string), typeof(BarChartControl), new PropertyMetadata());

        private void BarChartControl_OnLoaded(object sender, RoutedEventArgs e)
        {
            MainBorder.BorderBrush = BorderBrush;
            MainBorder.BorderThickness = BorderThickness;

            BottomGrid.Height = AxisX.Height;
            LeftGrid.Width = AxisY.Width;

            SetYTitlesContent();

            SetXDatasContent();
        }

        private void SetXDatasContent()
        {
            var axisXModel = AxisX;
            if (axisXModel.Datas.Count > 0)
            {
                int count = axisXModel.Datas.Count;
                for (int i = 0; i < count + 1; i++)
                {
                    BottomGrid.ColumnDefinitions.Add(new ColumnDefinition());
                    MainGridFrom0To1.ColumnDefinitions.Add(new ColumnDefinition());
                }
                int index = 0;
                foreach (var data in axisXModel.Datas)
                {
                    //底部
                    var textblock = new TextBlock();
                    textblock.Text = data.Name;
                    textblock.Foreground = axisXModel.ForeGround;
                    textblock.VerticalAlignment = VerticalAlignment.Top;
                    textblock.TextAlignment = TextAlignment.Center;
                    textblock.HorizontalAlignment = HorizontalAlignment.Right;
                    double textBlockWidth = data.LabelWidth;
                    textblock.Width = data.LabelWidth;
                    textblock.Margin = new Thickness(0, 5, -textBlockWidth / 2, 0);
                    Grid.SetColumn(textblock, index);
                    BottomGrid.Children.Add(textblock);


                    //主内容
                    var stackPanel = new StackPanel();
                    stackPanel.Orientation = Orientation.Vertical;

                    var tbl = new TextBlock();
                    tbl.Height = 15;
                    tbl.Margin = new Thickness(0, 0, 0, 5);
                    tbl.Text = data.Value.ToString();
                    tbl.Foreground = axisXModel.ForeGround;
                    tbl.HorizontalAlignment = HorizontalAlignment.Center;
                    stackPanel.Children.Add(tbl);

                    var rectangle = new Rectangle();
                    rectangle.Width = data.BarWidth;
                    double maxValue = AxisY.Titles.Max(i => i.Value);
                    rectangle.Height = (data.Value / maxValue) * (this.ActualHeight - BottomGrid.Height - HeaderHeight);
                    var linearBrush = new LinearGradientBrush()
                    {
                        StartPoint = new Point(1, 0),
                        EndPoint = new Point(1, 1),
                        GradientStops = new GradientStopCollection() {
                            new GradientStop()
                            {
                                Color = data.FillBrush, Offset = 0
                            }, new GradientStop()
                            {
                                Color = data.FillEndBrush, Offset = 1
                            }
                        }
                    };
                    rectangle.Fill = linearBrush;
                    rectangle.HorizontalAlignment = HorizontalAlignment.Center;

                    stackPanel.Children.Add(rectangle);
                    stackPanel.Margin = new Thickness(0, 0, -textBlockWidth / 2, 0);
                    stackPanel.VerticalAlignment = VerticalAlignment.Bottom;
                    stackPanel.HorizontalAlignment = HorizontalAlignment.Right;
                    Grid.SetColumn(stackPanel, index);
                    MainGridFrom0To1.Children.Add(stackPanel);
                    index++;
                }
            }
        }

        private void SetYTitlesContent()
        {
            var axisYModel = AxisY;
            if (axisYModel.Titles.Count > 0)
            {
                int gridRows = axisYModel.Titles.Count - 1;
                for (int i = 0; i < gridRows; i++)
                {
                    LeftGrid.RowDefinitions.Add(new RowDefinition());
                    MainGridForRow1.RowDefinitions.Add(new RowDefinition());
                }
                int index = 0;
                foreach (var title in axisYModel.Titles)
                {
                    var textblock = new TextBlock();
                    textblock.Text = title.Name;
                    textblock.Foreground = axisYModel.ForeGround;
                    textblock.HorizontalAlignment = HorizontalAlignment.Right;
                    textblock.Height = title.LabelHeight;
                    if (index < gridRows)
                    {
                        textblock.VerticalAlignment = VerticalAlignment.Bottom;
                        textblock.Margin = new Thickness(0, 0, 5, -title.LabelHeight / 2);//因为设置在行底部还不够,必须往下移
                        Grid.SetRow(textblock, gridRows - index - 1);
                    }
                    else
                    {
                        textblock.VerticalAlignment = VerticalAlignment.Top;
                        textblock.Margin = new Thickness(0, -title.LabelHeight / 2, 5, 0);//最后一个,设置在顶部
                        Grid.SetRow(textblock, 0);
                    }
                    LeftGrid.Children.Add(textblock);

                    var border = new Border();
                    border.Height = title.LineHeight;
                    border.BorderBrush = title.LineBrush;
                    double thickness = Convert.ToDouble(title.LineHeight) / 2;
                    border.BorderThickness = new Thickness(0, thickness, 0, thickness);
                    if (index < gridRows)
                    {
                        border.VerticalAlignment = VerticalAlignment.Bottom;
                        border.Margin = new Thickness(0, 0, 0, -thickness);//因为设置在行底部还不够,必须往下移
                        Grid.SetRow(border, gridRows - index - 1);
                    }
                    else
                    {
                        border.VerticalAlignment = VerticalAlignment.Top;
                        border.Margin = new Thickness(0, -thickness, 0, 0);//最后一个,设置在顶部
                        Grid.SetRow(border, 0);
                    }
                    Grid.SetColumn(border, 0);
                    Grid.SetColumnSpan(border, AxisX.Datas.Count + 1);
                    MainGridForRow1.Children.Add(border);
                    index++;
                }
            }
        }
        /// <summary>
        /// 设置分行
        /// </summary>
        /// <param name="leftGrid"></param>
        /// <param name="count"></param>
        private void SetGridRowDefinitions(Grid leftGrid, int count)
        {
            for (int i = 0; i < count; i++)
            {
                leftGrid.RowDefinitions.Add(new RowDefinition());
            }
        }
    }
    public class AxisXModel
    {
        private double _height = 20;
        /// <summary>
        /// 高度
        /// </summary>
        public double Height
        {
            get
            {
                return _height;
            }
            set { _height = value; }
        }

        private Brush _foreGround = Brushes.Black;
        /// <summary>
        /// 字体颜色
        /// </summary>
        public Brush ForeGround
        {
            get { return _foreGround; }
            set { _foreGround = value; }
        }

        List<AxisXDataModel> _datas = new List<AxisXDataModel>();
        /// <summary>
        /// 数据
        /// </summary>
        public List<AxisXDataModel> Datas
        {
            get { return _datas; }
            set { _datas = value; }
        }
    }
    public class AxisYModel
    {
        private double _width = 20;
        /// <summary>
        /// 宽度
        /// </summary>
        public double Width { get { return _width; } set { _width = value; } }

        private Brush _foreGround = Brushes.Black;
        /// <summary>
        /// 字体颜色
        /// </summary>
        public Brush ForeGround { get { return _foreGround; } set { _foreGround = value; } }

        List<AxisYDataModel> _titles = new List<AxisYDataModel>();
        /// <summary>
        /// 左侧标题列表
        /// </summary>
        public List<AxisYDataModel> Titles
        {
            get { return _titles; }
            set { _titles = value; }
        }
    }
    public class AxisXDataModel : DataModel
    {
        private double _labelWidth = 20;
        /// <summary>
        /// 底部标签-单个宽度
        /// </summary>
        public double LabelWidth
        {
            get { return _labelWidth; }
            set { _labelWidth = value; }
        }
        private double _barWidth = 20;
        /// <summary>
        /// Bar宽度
        /// </summary>
        public double BarWidth
        {
            get { return _barWidth; }
            set { _barWidth = value; }
        }

        private Color _fillBrush = Colors.Blue;
        /// <summary>
        /// Bar填充颜色
        /// </summary>
        public Color FillBrush
        {
            get
            {
                return _fillBrush;
            }
            set { _fillBrush = value; }
        }

        private Color _fillEndBrush = Colors.Blue;

        public Color FillEndBrush
        {
            get
            {
                return _fillEndBrush;
            }
            set { _fillEndBrush = value; }
        }
    }
    public class AxisYDataModel : DataModel
    {
        private double _labelHeight = 15;
        /// <summary>
        /// 左侧标题栏-单个标题高度
        /// </summary>
        public double LabelHeight
        {
            get { return _labelHeight; }
            set { _labelHeight = value; }
        }
        private double _lineHeight = 0.2;
        /// <summary>
        /// GridLine高度
        /// </summary>
        public double LineHeight
        {
            get { return _lineHeight; }
            set { _lineHeight = value; }
        }

        private Brush _lineBrush = Brushes.Blue;
        /// <summary>
        /// Bar填充颜色
        /// </summary>
        public Brush LineBrush
        {
            get { return _lineBrush; }
            set { _lineBrush = value; }
        }
    }
    public class DataModel
    {
        /// <summary>
        /// 显示名称
        /// </summary>
        public string Name { get; set; }
        /// <summary>
        /// 值
        /// </summary>
        public double Value { get; set; }
    }
3、主界面引用
<Window
        xmlns="http://schemas.microsoft.com/winfx/2006/xaml/presentation"
        xmlns:x="http://schemas.microsoft.com/winfx/2006/xaml"
        xmlns:wpfApplication11="clr-namespace:WpfApplication11"
        x:Class="WpfApplication11.MainWindow"
        Title="MainWindow" Height="350" Width="600" Background="#FF7CADBD">
    <Grid>
        <wpfApplication11:BarChartControl BorderBrush="White" Width="500" Height="250" BorderThickness="2,0,2,0" HeaderHeight="20">
            <wpfApplication11:BarChartControl.AxisY>
                <wpfApplication11:AxisYModel Width="30" ForeGround="White">
                    <wpfApplication11:AxisYModel.Titles>
                        <wpfApplication11:AxisYDataModel Name="0" Value="0"></wpfApplication11:AxisYDataModel>
                        <wpfApplication11:AxisYDataModel Name="20" Value="20"></wpfApplication11:AxisYDataModel>
                        <wpfApplication11:AxisYDataModel Name="40" Value="40"></wpfApplication11:AxisYDataModel>
                        <wpfApplication11:AxisYDataModel Name="60" Value="60"></wpfApplication11:AxisYDataModel>
                        <wpfApplication11:AxisYDataModel Name="80" Value="80"></wpfApplication11:AxisYDataModel>
                        <wpfApplication11:AxisYDataModel Name="100" Value="100"></wpfApplication11:AxisYDataModel>
                    </wpfApplication11:AxisYModel.Titles>
                </wpfApplication11:AxisYModel>
            </wpfApplication11:BarChartControl.AxisY>
            <wpfApplication11:BarChartControl.AxisX>
                <wpfApplication11:AxisXModel Height="30" ForeGround="White">
                    <wpfApplication11:AxisXModel.Datas>
                        <wpfApplication11:AxisXDataModel Name="A" Value="100" FillBrush="DeepSkyBlue" FillEndBrush="#FF6CD7FB"></wpfApplication11:AxisXDataModel>
                        <wpfApplication11:AxisXDataModel Name="B" Value="50"  FillBrush="#FF06F906" FillEndBrush="#FF5CF95C"></wpfApplication11:AxisXDataModel>
                        <wpfApplication11:AxisXDataModel Name="C" Value="70"  FillBrush="Cyan" FillEndBrush="#FF4DFFFF"></wpfApplication11:AxisXDataModel>
                        <wpfApplication11:AxisXDataModel Name="D" Value="30" FillBrush="GreenYellow" FillEndBrush="#FFBFFD60"></wpfApplication11:AxisXDataModel>
                        <wpfApplication11:AxisXDataModel Name="E" Value="86" FillBrush="DarkOrchid" FillEndBrush="#FFCC73F7"></wpfApplication11:AxisXDataModel>
                        <wpfApplication11:AxisXDataModel Name="F" Value="60" FillBrush="Coral" FillEndBrush="#FFF9A181"></wpfApplication11:AxisXDataModel>
                    </wpfApplication11:AxisXModel.Datas>
                </wpfApplication11:AxisXModel>
            </wpfApplication11:BarChartControl.AxisX>
        </wpfApplication11:BarChartControl>
    </Grid>
</Window>
以上是通过Grid均分布局来完成的。
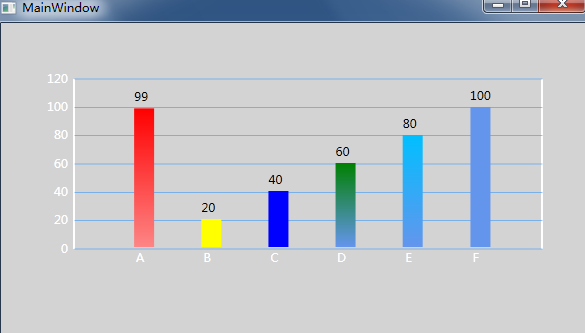
之前也尝试过用Canvas来布局,相对来说,在小范围试用还是可以的,定义成控件还是不好,有点局限,比如宽度、高度等,有点死。
GitHub下载地址:https://github.com/Kybs0/WpfApplication9
1、UserControl界面
<UserControl x:Class="WpfApplication9.BarChartControl"
        xmlns="http://schemas.microsoft.com/winfx/2006/xaml/presentation"
        xmlns:x="http://schemas.microsoft.com/winfx/2006/xaml"
        xmlns:mc="http://schemas.openxmlformats.org/markup-compatibility/2006"
        xmlns:d="http://schemas.microsoft.com/expression/blend/2008"
        mc:Ignorable="d" Height="200" Width="400"
        d:DesignHeight="200" d:DesignWidth="600" Loaded="BarChartControl_OnLoaded">
    <Grid>
        <Grid.RowDefinitions>
            <RowDefinition Height="*"></RowDefinition>
            <RowDefinition Height="Auto"></RowDefinition>
        </Grid.RowDefinitions>
        <Grid.ColumnDefinitions>
            <ColumnDefinition Width="Auto"></ColumnDefinition>
            <ColumnDefinition Width="*"></ColumnDefinition>
            <ColumnDefinition Width="Auto"></ColumnDefinition>
        </Grid.ColumnDefinitions>

        <Canvas x:Name="LeftCanvas" Grid.Row="0" Grid.Column="0" Width="30">
        </Canvas>
        <Border x:Name="MainBorder" Grid.Row="0" Grid.Column="1" BorderThickness="2,0,2,2" BorderBrush="Black" Padding="2,0,1,0">
            <Canvas x:Name="MainCanvas">

            </Canvas>
        </Border>
        <Canvas x:Name="RightCanvas" Grid.Row="0" Grid.Column="2">
        </Canvas>

        <Canvas x:Name="BottomCanvas" Grid.Row="1" Grid.Column="1" Height="30">
        </Canvas>
    </Grid>
</UserControl>
2、UserControl后台
 public partial class BarChartControl : UserControl
    {
        public BarChartControl()
        {
            InitializeComponent();
        }

        public Brush BorderBrush
        {
            get { return (Brush) GetValue(BorderBrushProperty); }
            set { SetValue(BorderBrushProperty, value); }
        }

        public static readonly DependencyProperty BorderBrushProperty = DependencyProperty.Register("BorderBrush",
            typeof (Brush), typeof (BarChartControl),
            new PropertyMetadata(Brushes.Black));

        public Thickness BorderThickness
        {
            get { return (Thickness) GetValue(BorderThicknessProperty); }
            set { SetValue(BorderThicknessProperty, value); }
        }

        public static readonly DependencyProperty BorderThicknessProperty =
            DependencyProperty.Register("BorderThickness",
                typeof (Thickness), typeof (BarChartControl),
                new PropertyMetadata(new Thickness(1.0, 0.0, 1.0, 1.0)));

        public AxisYModel AxisY
        {
            get { return (AxisYModel) GetValue(AxisYProperty); }
            set { SetValue(AxisYProperty, value); }
        }

        public static readonly DependencyProperty AxisYProperty = DependencyProperty.Register("AxisY",
            typeof (AxisYModel), typeof (BarChartControl),
            new PropertyMetadata(new AxisYModel()));

        public AxisXModel AxisX
        {
            get { return (AxisXModel) GetValue(AxisXProperty); }
            set { SetValue(AxisXProperty, value); }
        }

        public static readonly DependencyProperty AxisXProperty = DependencyProperty.Register("AxisX",
            typeof (AxisXModel), typeof (BarChartControl),
            new PropertyMetadata(new AxisXModel()));

        private void BarChartControl_OnLoaded(object sender, RoutedEventArgs e)
        {
            MainBorder.BorderBrush = BorderBrush;
            MainBorder.BorderThickness = BorderThickness;

            SetYTitlesContent();

            SetXDatasContent();
        }

        private void SetXDatasContent()
        {
            var axisXModel = AxisX;
            if (axisXModel.Datas.Count > 0)
            {
                BottomCanvas.Height = axisXModel.Height;
                double width = MainBorder.ActualWidth;


                int count = axisXModel.Datas.Count;
                int index = 1;
                foreach (var data in axisXModel.Datas)
                {
                    var textblock = new TextBlock();
                    textblock.Text = data.Name;
                    textblock.Foreground = axisXModel.ForeGround;
                    textblock.TextAlignment = TextAlignment.Center;
                    //textblock.VerticalAlignment = VerticalAlignment.Top;
                    //textblock.Height = axisXModel.Height;
                    double textBlockWidth = axisXModel.LabelWidth;
                    textblock.Width = textBlockWidth;
                    //textblock.Padding = new Thickness(0, 0, 5, 0);
                    double leftLength = width*Convert.ToDouble(index)/(count + 1) - textBlockWidth/2;
                    Canvas.SetLeft(textblock, leftLength);
                    BottomCanvas.Children.Add(textblock);

                    var stackPanel = new StackPanel();
                    stackPanel.Orientation = Orientation.Vertical;

                    var tbl = new TextBlock();
                    tbl.Height = 15;
                    tbl.Margin = new Thickness(0, 0, 0, 5);
                    tbl.Text = data.Value.ToString();
                    stackPanel.Children.Add(tbl);

                    var rectangle = new Rectangle();
                    rectangle.Width = data.BarWidth;
                    double maxValue = AxisY.Titles.Max(i => i.Value);
                    rectangle.Height = (data.Value/maxValue)*MainCanvas.ActualHeight;
                    var linearBrush = new LinearGradientBrush()
                    {
                        StartPoint = new Point(1, 0),
                        EndPoint = new Point(1, 1),
                        GradientStops = new GradientStopCollection()
                        {
                            new GradientStop()
                            {
                                Color = data.FillBrush,
                                Offset = 0
                            },
                            new GradientStop()
                            {
                                Color = data.FillEndBrush,
                                Offset = 1
                            }
                        }
                    };
                    rectangle.Fill = linearBrush;
                    stackPanel.Children.Add(rectangle);

                    double leftBarLength = width*Convert.ToDouble(index)/(count + 1) - data.BarWidth/2;
                    Canvas.SetLeft(stackPanel, leftBarLength);

                    Canvas.SetTop(stackPanel, MainCanvas.ActualHeight - (rectangle.Height + 20));

                    MainCanvas.Children.Add(stackPanel);
                    index++;
                }
            }
        }

        private void SetYTitlesContent()
        {
            var axisYModel = AxisY;
            if (axisYModel.Titles.Count > 0)
            {
                LeftCanvas.Width = axisYModel.Width;
                double height = MainBorder.ActualHeight;

                int index = 0;
                int count = axisYModel.Titles.Count;
                foreach (var title in axisYModel.Titles)
                {
                    var textblock = new TextBlock();
                    textblock.Text = title.Name;
                    textblock.Foreground = axisYModel.ForeGround;
                    textblock.TextAlignment = TextAlignment.Right;
                    textblock.Width = axisYModel.Width;
                    double textBlockHeight = 18;
                    textblock.Height = textBlockHeight;
                    textblock.Padding = new Thickness(0, 0, 5, 0);
                    double topLength = height - height*Convert.ToDouble(index)/(count - 1) - textBlockHeight/2;
                    Canvas.SetTop(textblock, topLength);
                    LeftCanvas.Children.Add(textblock);

                    var path = new Path();
                    path.Stroke = Brushes.DodgerBlue;
                    path.StrokeThickness = 0.5;

                    var startPoint = new Point(0, height - height*Convert.ToDouble(index)/(count - 1));
                    var endPoint = new Point(MainCanvas.ActualWidth, height - height*Convert.ToDouble(index)/(count - 1));
                    path.Data = new PathGeometry()
                    {
                        Figures = new PathFigureCollection()
                        {
                            new PathFigure()
                            {
                                IsClosed = true,
                                StartPoint = startPoint,
                                Segments = new PathSegmentCollection()
                                {
                                    new LineSegment() {Point = endPoint}
                                }
                            }
                        }
                    };
                    MainCanvas.Children.Add(path);
                    index++;
                }
            }
        }
    }

    public class AxisXModel
    {
        public double Height { get; set; }

        private double _lableWidth = 50;

        public double LabelWidth
        {
            get { return _lableWidth; }
            set { _lableWidth = value; }
        }

        public Brush ForeGround { get; set; }
        private List<DataModel> _titles = new List<DataModel>();

        public List<DataModel> Datas
        {
            get { return _titles; }
            set { _titles = value; }
        }
    }

    public class AxisYModel
    {
        public double Width { get; set; }

        public Brush ForeGround { get; set; }

        private List<DataModel> _titles = new List<DataModel>();

        public List<DataModel> Titles
        {
            get { return _titles; }
            set { _titles = value; }
        }
    }

    public class DataModel
    {
        public string Name { get; set; }
        public double Value { get; set; }

        private double _barWidth = 20;

        public double BarWidth
        {
            get { return _barWidth; }
            set { _barWidth = value; }
        }

        public Color FillBrush { get; set; }
        public Color FillEndBrush { get; set; }
    }
3、引用
<Window x:Class="WpfApplication9.MainWindow"
        xmlns="http://schemas.microsoft.com/winfx/2006/xaml/presentation"
        xmlns:x="http://schemas.microsoft.com/winfx/2006/xaml"
        xmlns:wpfApplication9="clr-namespace:WpfApplication9"
        Title="MainWindow" Height="350" Width="600" Background="LightGray">
    <Grid>
        <wpfApplication9:BarChartControl BorderBrush="White" Width="500" BorderThickness="2,0,2,0">
            <wpfApplication9:BarChartControl.AxisY>
                <wpfApplication9:AxisYModel Width="30" ForeGround="White">
                    <wpfApplication9:AxisYModel.Titles>
                        <wpfApplication9:DataModel Name="0" Value="0"></wpfApplication9:DataModel>
                        <wpfApplication9:DataModel Name="20" Value="20"></wpfApplication9:DataModel>
                        <wpfApplication9:DataModel Name="40" Value="40"></wpfApplication9:DataModel>
                        <wpfApplication9:DataModel Name="60" Value="60"></wpfApplication9:DataModel>
                        <wpfApplication9:DataModel Name="80" Value="80"></wpfApplication9:DataModel>
                        <wpfApplication9:DataModel Name="100" Value="100"></wpfApplication9:DataModel>
                        <wpfApplication9:DataModel Name="120" Value="120">
                        </wpfApplication9:DataModel>
                    </wpfApplication9:AxisYModel.Titles>
                </wpfApplication9:AxisYModel>
            </wpfApplication9:BarChartControl.AxisY>
            <wpfApplication9:BarChartControl.AxisX>
                <wpfApplication9:AxisXModel Height="30" ForeGround="White">
                    <wpfApplication9:AxisXModel.Datas>
                        <wpfApplication9:DataModel Name="A" Value="99" FillBrush="Red" FillEndBrush="#FFFD8585"></wpfApplication9:DataModel>
                        <wpfApplication9:DataModel Name="B" Value="20" FillBrush="Yellow" FillEndBrush="Yellow"></wpfApplication9:DataModel>
                        <wpfApplication9:DataModel Name="C" Value="40" FillBrush="Blue" FillEndBrush="Blue"></wpfApplication9:DataModel>
                        <wpfApplication9:DataModel Name="D" Value="60" FillBrush="Green" FillEndBrush="CornflowerBlue"></wpfApplication9:DataModel>
                        <wpfApplication9:DataModel Name="E" Value="80" FillBrush="DeepSkyBlue" FillEndBrush="CornflowerBlue"></wpfApplication9:DataModel>
                        <wpfApplication9:DataModel Name="F" Value="100" FillBrush="CornflowerBlue" FillEndBrush="CornflowerBlue"></wpfApplication9:DataModel>
                    </wpfApplication9:AxisXModel.Datas>
                </wpfApplication9:AxisXModel>
            </wpfApplication9:BarChartControl.AxisX>
        </wpfApplication9:BarChartControl>
    </Grid>
</Window>
智能推荐
什么是内部类?成员内部类、静态内部类、局部内部类和匿名内部类的区别及作用?_成员内部类和局部内部类的区别-程序员宅基地
文章浏览阅读3.4k次,点赞8次,收藏42次。一、什么是内部类?or 内部类的概念内部类是定义在另一个类中的类;下面类TestB是类TestA的内部类。即内部类对象引用了实例化该内部对象的外围类对象。public class TestA{ class TestB {}}二、 为什么需要内部类?or 内部类有什么作用?1、 内部类方法可以访问该类定义所在的作用域中的数据,包括私有数据。2、内部类可以对同一个包中的其他类隐藏起来。3、 当想要定义一个回调函数且不想编写大量代码时,使用匿名内部类比较便捷。三、 内部类的分类成员内部_成员内部类和局部内部类的区别
分布式系统_分布式系统运维工具-程序员宅基地
文章浏览阅读118次。分布式系统要求拆分分布式思想的实质搭配要求分布式系统要求按照某些特定的规则将项目进行拆分。如果将一个项目的所有模板功能都写到一起,当某个模块出现问题时将直接导致整个服务器出现问题。拆分按照业务拆分为不同的服务器,有效的降低系统架构的耦合性在业务拆分的基础上可按照代码层级进行拆分(view、controller、service、pojo)分布式思想的实质分布式思想的实质是为了系统的..._分布式系统运维工具
用Exce分析l数据极简入门_exce l趋势分析数据量-程序员宅基地
文章浏览阅读174次。1.数据源准备2.数据处理step1:数据表处理应用函数:①VLOOKUP函数; ② CONCATENATE函数终表:step2:数据透视表统计分析(1) 透视表汇总不同渠道用户数, 金额(2)透视表汇总不同日期购买用户数,金额(3)透视表汇总不同用户购买订单数,金额step3:讲第二步结果可视化, 比如, 柱形图(1)不同渠道用户数, 金额(2)不同日期..._exce l趋势分析数据量
宁盾堡垒机双因素认证方案_horizon宁盾双因素配置-程序员宅基地
文章浏览阅读3.3k次。堡垒机可以为企业实现服务器、网络设备、数据库、安全设备等的集中管控和安全可靠运行,帮助IT运维人员提高工作效率。通俗来说,就是用来控制哪些人可以登录哪些资产(事先防范和事中控制),以及录像记录登录资产后做了什么事情(事后溯源)。由于堡垒机内部保存着企业所有的设备资产和权限关系,是企业内部信息安全的重要一环。但目前出现的以下问题产生了很大安全隐患:密码设置过于简单,容易被暴力破解;为方便记忆,设置统一的密码,一旦单点被破,极易引发全面危机。在单一的静态密码验证机制下,登录密码是堡垒机安全的唯一_horizon宁盾双因素配置
谷歌浏览器安装(Win、Linux、离线安装)_chrome linux debian离线安装依赖-程序员宅基地
文章浏览阅读7.7k次,点赞4次,收藏16次。Chrome作为一款挺不错的浏览器,其有着诸多的优良特性,并且支持跨平台。其支持(Windows、Linux、Mac OS X、BSD、Android),在绝大多数情况下,其的安装都很简单,但有时会由于网络原因,无法安装,所以在这里总结下Chrome的安装。Windows下的安装:在线安装:离线安装:Linux下的安装:在线安装:离线安装:..._chrome linux debian离线安装依赖
烤仔TVの尚书房 | 逃离北上广?不如押宝越南“北上广”-程序员宅基地
文章浏览阅读153次。中国发达城市榜单每天都在刷新,但无非是北上广轮流坐庄。北京拥有最顶尖的文化资源,上海是“摩登”的国际化大都市,广州是活力四射的千年商都。GDP和发展潜力是衡量城市的数字指...
随便推点
java spark的使用和配置_使用java调用spark注册进去的程序-程序员宅基地
文章浏览阅读3.3k次。前言spark在java使用比较少,多是scala的用法,我这里介绍一下我在项目中使用的代码配置详细算法的使用请点击我主页列表查看版本jar版本说明spark3.0.1scala2.12这个版本注意和spark版本对应,只是为了引jar包springboot版本2.3.2.RELEASEmaven<!-- spark --> <dependency> <gro_使用java调用spark注册进去的程序
汽车零部件开发工具巨头V公司全套bootloader中UDS协议栈源代码,自己完成底层外设驱动开发后,集成即可使用_uds协议栈 源代码-程序员宅基地
文章浏览阅读4.8k次。汽车零部件开发工具巨头V公司全套bootloader中UDS协议栈源代码,自己完成底层外设驱动开发后,集成即可使用,代码精简高效,大厂出品有量产保证。:139800617636213023darcy169_uds协议栈 源代码
AUTOSAR基础篇之OS(下)_autosar 定义了 5 种多核支持类型-程序员宅基地
文章浏览阅读4.6k次,点赞20次,收藏148次。AUTOSAR基础篇之OS(下)前言首先,请问大家几个小小的问题,你清楚:你知道多核OS在什么场景下使用吗?多核系统OS又是如何协同启动或者关闭的呢?AUTOSAR OS存在哪些功能安全等方面的要求呢?多核OS之间的启动关闭与单核相比又存在哪些异同呢?。。。。。。今天,我们来一起探索并回答这些问题。为了便于大家理解,以下是本文的主题大纲:[外链图片转存失败,源站可能有防盗链机制,建议将图片保存下来直接上传(img-JCXrdI0k-1636287756923)(https://gite_autosar 定义了 5 种多核支持类型
VS报错无法打开自己写的头文件_vs2013打不开自己定义的头文件-程序员宅基地
文章浏览阅读2.2k次,点赞6次,收藏14次。原因:自己写的头文件没有被加入到方案的包含目录中去,无法被检索到,也就无法打开。将自己写的头文件都放入header files。然后在VS界面上,右键方案名,点击属性。将自己头文件夹的目录添加进去。_vs2013打不开自己定义的头文件
【Redis】Redis基础命令集详解_redis命令-程序员宅基地
文章浏览阅读3.3w次,点赞80次,收藏342次。此时,可以将系统中所有用户的 Session 数据全部保存到 Redis 中,用户在提交新的请求后,系统先从Redis 中查找相应的Session 数据,如果存在,则再进行相关操作,否则跳转到登录页面。此时,可以将系统中所有用户的 Session 数据全部保存到 Redis 中,用户在提交新的请求后,系统先从Redis 中查找相应的Session 数据,如果存在,则再进行相关操作,否则跳转到登录页面。当数据量很大时,count 的数量的指定可能会不起作用,Redis 会自动调整每次的遍历数目。_redis命令
URP渲染管线简介-程序员宅基地
文章浏览阅读449次,点赞3次,收藏3次。URP的设计目标是在保持高性能的同时,提供更多的渲染功能和自定义选项。与普通项目相比,会多出Presets文件夹,里面包含着一些设置,包括本色,声音,法线,贴图等设置。全局只有主光源和附加光源,主光源只支持平行光,附加光源数量有限制,主光源和附加光源在一次Pass中可以一起着色。URP:全局只有主光源和附加光源,主光源只支持平行光,附加光源数量有限制,一次Pass可以计算多个光源。可编程渲染管线:渲染策略是可以供程序员定制的,可以定制的有:光照计算和光源,深度测试,摄像机光照烘焙,后期处理策略等等。_urp渲染管线